Labor Costs Are a Risky Part of Your Business. Make an Immediate Impact on Your Bottom Line by Heading off Costly Labor Over-runs Before They Get Out of Hand.
7 Ways to Reduce Labor Costs
- Know and use your true, fully burdened labor costs when estimating.
- Increase estimating accuracy by using costs based on specific employees (or averages based on employee levels).
- Monitor what level of employee is working on various aspects of the job.
- Continually monitor time and cost progress against estimates.
- If a job stage is taking longer than estimated, try to find out why and see if the problem can be addressed as quickly as possible.
- Use what you learn to improve internal processes.
- Use job costing reports to refine your estimates for future jobs.
Keys To Reducing Labor Costs and Labor Cost Over-runs
1. Make sure you are using fully-burdened labor costs in your bids.
Unless you are using full labor rate burdens in your bids, you will always underestimate the actual cost of the labor to do the job.
2. Carefully monitor the job while in process to ensure the mix of employees working the job is consistent with what is included in your bid.
While it may be easier to just send an available employee out on a job, if their fully-burdened labor rate is higher than what you bid, you will incur cost overruns.
3. Carefully monitor the job while in process to ensure the hours spent on the job are consistent with what is included in your bid.
Every extra hour spent over your estimated hours will be a cost overrun.
Estimated vs. Actual Labor Costs
ILLUSTRATION 1
Use Fully-Burdened Labor Costs
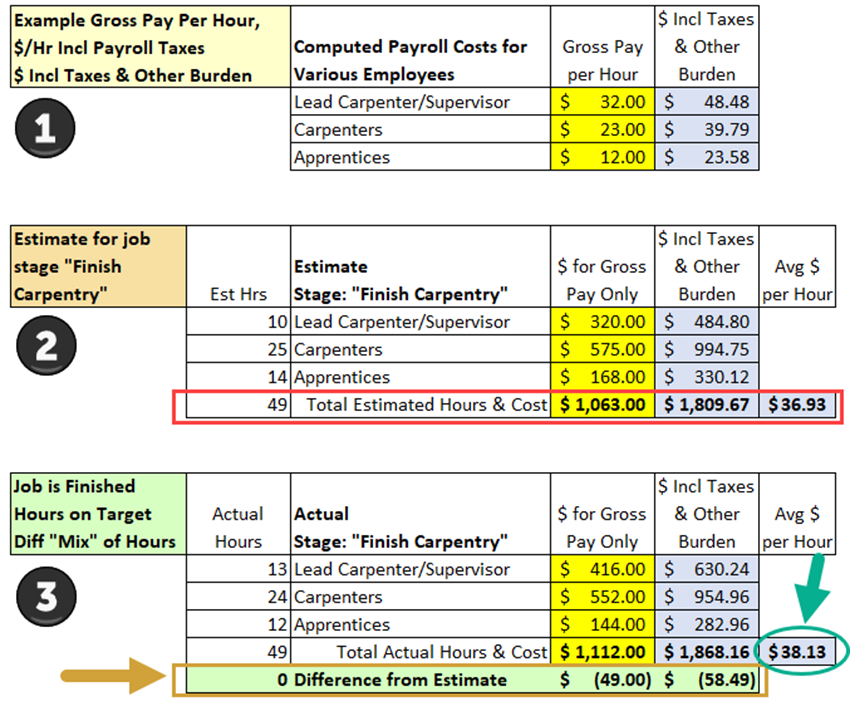
1. The first section of Illustration 1 shows three different levels of employees. You’ll see both Gross Pay per Hour (in yellow) and the full dollar amount (Including Taxes and Other Burden – in blue) for each.
2. The middle section of the illustration above shows just the “Finish Carpentry” section of a job. In the leftmost column, you’ll see 49 estimated hours. The columns on the right show gross pay only as well as fully-burdened costs (taxes and other burden costs).
You’ll notice that your TRUE (fully burdened) costs of $1,809.67 are significantly higher than the gross payroll costs of $1,063. (In this case, the difference is $746.67.)
WHAT THIS MEANS: Unless you’re seeing fully burdened costs per hour in your job costing, you are NOT seeing the true costs of your labor.
Make Sure Labor Division of Work Is Consistent With Your Bid
 3. The bottom (third) section shows an example of results where the crew completes the job within the estimated 49 hours. BUT, the section highlighted with the gold arrow and box shows that the actual hours worked by different employees were different than estimated. You’ll also notice that the average cost per hour changed from $36.93 per hour to $38.13 per hour (aqua-colored arrow and circle).
This “who-does-what-time-shift” created a cost overage of $58.49 (3.2% above the estimate).
WHAT THIS MEANS: When work gets shifted between employees with different hourly rates, your job costs change…
Ensure Labor Actual Hours Worked Matches Bid Amount
ILLUSTRATION 2
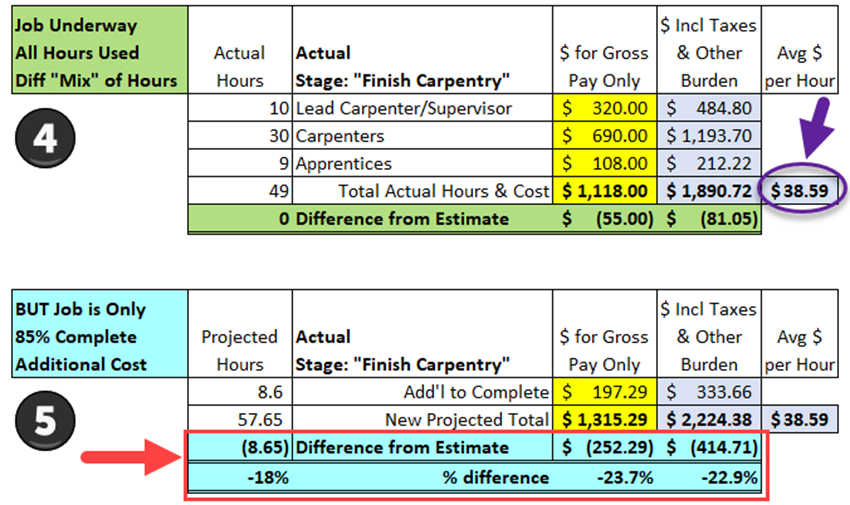
4. In the top section of illustration #2, we’re still at 49 hours, but to continue with the point made in comment #3 above, I’ve shifted the “who-does-what” hours again. You’ll see the average hourly rate has gone up from $38.13 to $38.59, and our difference from the estimated amount is $81.05 (see the olive green row).
5. BUT THERE’S A PROBLEM! Even though we’ve worked the estimated 49 hours on this portion of the job, it isn’t done. Our supervisor lets us know that he believes we’re only about 85% of the way through.
So, I’ve added another 8.65 hours in the same proportion of costs to date. The result? It looks like we’re going to be $414.71 (22.9%) over budget!
WHAT THIS MEANS: Labor costs can spin out of control very quickly!
…
QuickBooks Job Costing Reporting
ACCOUNTING VIEW:
WHAT THIS WOULD LOOK LIKE IN YOUR QUICKBOOKS JOB COSTING REPORTS
Assuming that you’re using fully-burdened labor costs in your job costing reports, this is what an Estimated vs. Actual Job Costing Report would look like if you look at both the Rough Carpentry (not previously illustrated) and the Finish Carpentry outlined above:
ILLUSTRATION 3
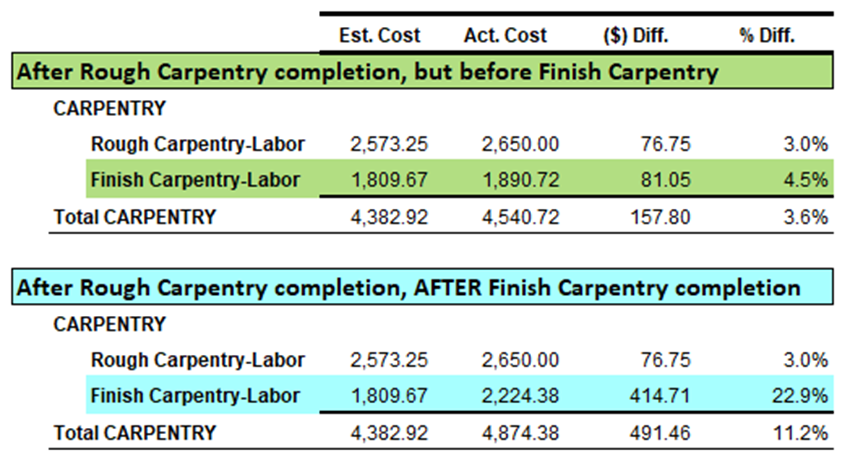
The green notes and rows show what you’d see in an “interim” report, and the aqua notes and rows show what you’d see after all costs have been entered at the conclusion of the job.
NOTE: Of course, the notes and colors wouldn’t be shown in a standard report, and to keep the illustration a manageable size, I’ve excluded other job stages and income columns that you’d normally find in an Estimated vs. Actual Job Costing Report.
![]()
People Also Ask
FAQs (Frequently Asked Questions)
1. What are labor overruns in construction?
Labor overruns in construction refer to unexpected increases in labor costs due to inefficiencies, mismanagement, or unforeseen issues on a project. These can significantly impact the profitability of a job.
2. How can I prevent labor overruns on my projects?
Preventing labor overruns involves thorough planning, accurate scheduling, time tracking, consistent monitoring, and effective communication with your team. Using time tracking, project management, and job costing software can also help track and manage labor costs more efficiently.
3. What are the common causes of labor overruns?
Common causes of labor overruns include poor project management, inaccurate estimates, assigning higher-priced employees to lower-value tasks, unexpected changes in project scope, inadequate labor tracking, and lack of skilled workers.
4. How does controlling labor overruns improve profitability?
Controlling labor overruns improves profitability by ensuring that labor costs stay within budget. This helps maintain the overall profitability of the project and reduces the risk of financial losses.
5. What tools can help manage labor costs effectively?
Tools such as project management software, time tracking systems, and job costing software can help manage labor costs effectively by tracking labor hours, providing real-time cost data, and identifying potential issues early enough to bring them back under control.
6. How can accurate job costing prevent labor overruns?
Accurate job costing helps prevent labor overruns by providing detailed insights into labor costs, which in turn allows you to more effectively monitor labor costs throughout the project.
7. What role does communication play in preventing labor overruns?
Effective communication ensures that all team members are aware of their responsibilities, project timelines, the need to “do it right the first time,” how to respond to client “on-the-fly” requests, and how to adjust processes related to authorized Change Orders. Consistent communication helps prevent misunderstandings and ensures that labor overruns are minimized.
8. How can I train my team to reduce labor overruns?
Training your team on efficient work practices, time tracking and time management, and providing access to various job tracking tools can help reduce labor overruns. Top-down management buy-in and support, as well as regular training sessions and updates on best practices, are essential.
9. What impact do labor overruns have on project timelines?
Labor overruns can delay project timelines by causing work stoppages, requiring additional labor to complete tasks, and leading to rework. This can extend the project duration, increase costs, and contribute to client anxiety and payment collection problems.
10. How can I use historical data to manage labor overruns?
Using historical data from past projects can help identify patterns and trends in labor overruns. This allows you to create more accurate estimates and better manage labor costs on future projects.
Additional resources and guides are available on the Build Your Numbers website.
![]()
How To Reduce Labor Cost Overruns
- Regularly review and compare actual burdened job costs to your estimated burdened job costs while the job is in process (not waiting until it is complete because, by then, it’s too late to make adjustments to bring your costs into line.) Use the information to:
- Take immediate corrective action if needed (and possible) OR
- Use the results to refine your estimates for future jobs.
- Have you had a chance to run some of your own numbers? If so, what’s the FIRST way you’ll use your information? To share your insights, please email me from our Contact Us page …
- Click here to access a Labor Burden Calculator (eCPA employee Cost & Pricing Analyzer™).
I hope you’ve enjoyed insights about how to prevent labor overruns. It’s one of several articles related to labor costs) that demonstrates how you can add to your bottom line when you know each employee’s true hourly cost!
Disclaimer: All numbers presented here are theoretical and should not be construed as industry averages. You will need to use your own eCPA to see your own company’s true, fully burdened costs.
Related Articles: Labor Profit Time #3: Your Gross Profit Numbers May Be Misleading | Labor Profit Tip #5: The Secret to Making Better Hiring Decisions
Customer Praise For Diane Gilson, Info Plus Accounting, and BuildYourNumbers.com
⭐⭐⭐⭐⭐ From the Intuit FindAProAdvisor website:
“We have used Diane Gilson as a resource for job cost specific and general QuickBooks applications. She is a great resource and has provided useful advice re structure, what to do first, how to modify reports for specific uses, etc. Her responses have been timely and to the point. There is no doubt that we will use her in the future.”
See More Customer and Client Comments