Your QuickBooks Chart of Accounts is the foundation for your critical company reports. What unfortunate events can occur when it isn’t set up in the best possible way?
Your QuickBooks Chart Of Accounts
 How you set up your Chart of Accounts in QuickBooks is one of the most important decisions you can make.
It determines whether your QuickBooks data will be much harder – or much easier – to work with. In fact, a poorly developed Chart of Accounts can literally cost you hundreds or even thousands of hours of wasted time each year.
All of that pain could be corrected if you just used a “smart” Chart of Accounts. I’ll give you a step-by-step description of how to do that in a moment. But first, let me tell you a story.
What Happens When Your QuickBooks Chart Of Accounts Is Poorly Organized
Marcia was in the middle of sorting the day’s incoming mail when David, her boss (the company owner), popped into her office. Before he even spoke, Marcia thought, “Now what?”
As usual, he was in a hurry. “Say,” he said. “I just got back from that conference in Vegas, right? Well, while I was there, I went to a very cool marketing class. The guy who was running it is offering a special, limited-time program – so I need to make a decision right away. I’d like to know how much we’ve already spent on marketing this year. He’s calling this afternoon, so can you pull that together for me while I’m at lunch?”
 David’s company was a fairly small business, and Marcia was the multi-tasking Office Manager and sole bookkeeper. She groaned inside because she knew she would have to disappoint him (again!). But she did her best to maintain a composed exterior.
“I’ll see what I can do, but it’s going to take some time. It will probably be tomorrow before I can get that information put together.” Although she responded calmly, she was frantically thinking, “Finding that info is going to be a real hassle! I’m going to have to look through a whole boatload of this year’s data entries. Then I have to convert that information into a report that will give him what he’s looking for. I’m hoping that “tomorrow” is even possible, given what’s already on my plate for today…”
“Tomorrow?” David asked incredulously – with extra emphasis – his reaction when he was frustrated. (His tone implied that Marcia was not capable of doing her job. Sigh.)
About Your QuickBooks Chart of Accounts…
In this situation, what David didn’t realize was that his request was far more difficult than it sounded. Why?
David’s company had never set aside the time to design a “smart” QuickBooks Chart of Accounts. (And Marcia didn’t know how.)
As a result, every time David (or any of the company’s managers) needed financial information, it took a huge amount of work to extract useful results from the hodgepodge of accumulated data.
Poor Marcia… The official ‘keeper of data.’ She was trying to respond to the needs of managers and her boss. At the same time, she was also juggling plates, hats, and frying pans. Minute-by-minute and hour-by-hour, she had to shift what she was working on, depending on the priority of the moment.
And poor David! He’d been paying for all of the time that it took Marcia to extract data, and he was still missing the day-to-day info needed to run his business effectively!
Here’s What Happens When Your Chart Of Accounts In QuickBooks is Well Organized
 Instead, let’s imagine how things might have turned out if, months before, Marcia and David had taken the time to work on their QuickBooks Chart of Accounts.
They could have decided how to organize their financial information by defining specific, clearly labeled accounts that reflected their current business operations. Then, they could have created logical groupings, thus creating a “smart” QuickBooks Chart of Accounts.
If they had just tackled this critical step months before, almost any information they needed would have been right at their fingertips – available at the push of a button.
Properly Organizing Your Chart Of Accounts
The bedrock of all company information is the Chart of Accounts. Marcia’s and David’s story is a classic example of why having a strong Chart of Accounts can make life better for both the bookkeeping staff and the management team. Let’s see how Marcia and David could use the Chart of Accounts to quickly access both a “bird’s-eye-view” as well as detailed information about David’s business.
You’ll see that this approach will yield critical business information right when David wants it. Marcia will look like a rock star. And David will feel (and be) in control of what’s happening in his business.
STEP 1 – Create Clearly-labeled Accounts and Account Groupings Within Your QuickBooks Chart of Accounts
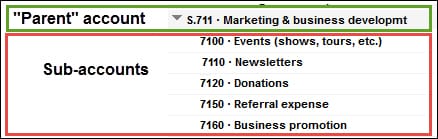
Since marketing costs are expenses for their company, here’s a helpful example. These are the types of accounts that they could have started entering into their QuickBooks Chart of Accounts.
Here, you see well-defined account titles for related costs grouped under a “header” or “parent” account:
STEP 2 – Enter Transactions and Create Useful Reports With Sub-Totals
After all accounts have been identified and placed into the QuickBooks Chart of Accounts for the company (for this example, we’re just focusing on marketing and sales costs), Marcia will enter and assign transactions to the correct accounts.
When she creates a Profit & Loss report in QuickBooks, the results will look like this:
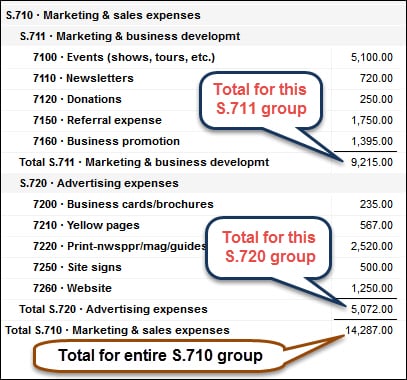
Now, she and David can see the totals for each individual account that they created when they set up their Chart of Accounts.
STEP 3 – Instantly Access Multiple Levels and Views of Information
A. Double-click to See Underlying Details in Your Chart of Accounts:
Let’s say David or Marcia want to see the individual transactions that make up the total in a specific account. (For this example, we’ll use the “Referral Expense” account.) They could just double-click on the amount shown in the report for that account to see a detailed listing of every single transaction.
Then, if they are curious about any specific transaction (e.g., a Bill or Check), they could double-click to see the actual transaction.
B. Summarize to See Sub-Totals by “Collapsing” Different Sections of the Report
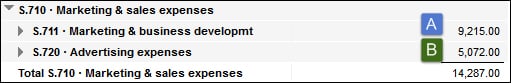
They may also want to see the sub-totals displayed in different ways, so they could “collapse” those groups to show JUST the totals for the two “sub-headers” (shown as “A” and “B” below) within the larger group of Marketing & Sales Expenses:
C. View Grand Totals
If they want to see only the grand total, they could simply click on the triangle icon for the S.710 Marketing & Sales Expenses header account:
![]()
This “grouping” approach can be used throughout their entire Chart of Accounts. So, if they had taken the time to get their Chart of Accounts properly set up, they could have quickly and easily seen any level of information – summarized or detailed – that they needed.
A Well-Organized Chart of Accounts
Let’s see how a well-organized Chart of Accounts could have made a huge difference.
Remember Marcia’s original reactions and response? (She groaned inside because she knew that she was going to have to disappoint him (again!)…)
A new story: Instead, Marcia could have been able to respond to David’s request like this:
“Sure thing. I’ll get that info emailed to you right away.”
Marcia smiled – she knew she had exactly what he needed. She simply went to her QuickBooks and pulled up a Profit & Loss report. After filtering it to show just the information David wanted, she pushed the email button to send it to David. Then, she went back to tackling the day’s mail.
David saw the email on his phone as he headed into his favorite taco place for lunch. He pulled up the report on his smartphone and reviewed it as he ate his Tacos al Pastor. Then, he called the marketing guru to confirm his spot in the program.
This is a very simple example of how a well-organized Chart of Accounts can help companies quickly access not only marketing data but can yield all types of critical information, information that can help them manage every facet of their company.
So, if the only thing you do after reading this post is to set up a logically designed and grouped Quickbooks Chart of Accounts, you’ll likely be miles ahead of where you were!
If reading this post also made you painfully aware that you really can’t afford to go another day trying to manage your business using the same old “half-fast” system you’ve been using, continue reading…
Do YOU Have A Similar Problem?
Here are a few questions:
- Have you ever tried to get financial information about your business and found out that you couldn’t get it as quickly as you really wanted or needed it?
- How frequently does this happen?
- As a business owner or bookkeeper, how does this make you feel regarding your ability to do your job and/or manage your business confidently?
How To Fix Your Chart Of Accounts
What if there was a fast and easy way for business owners and bookkeepers to implement a bullet-proof Chart of Accounts for their construction or manufacturing business? Well, there is.
Option A:
Here are two classes on creating (or upgrading to) an effective Charts of Accounts for your company:
- Building Your Chart of Accounts
(Basics: Building a Rock-solid Chart of Accounts in QuickBooks) - Remodeling Your QuickBooks Chart of Accounts
(Advanced: “A QuickBooks Chart of Accounts re-organization creates one of the ‘biggest bang-for-the-buck’ results you can achieve. For better management information, ‘start with the Chart’.”)
Option B:
The AccountingPRO™ system is specifically designed for construction business owners and bookkeepers who are too busy in their business to figure out how to organize the financial side of their business.
If you’re sick and tired of trying to run your business with a sub-standard set of numbers and missing financial data, then now is the time to check out AccountingPRO™.
Click the image below to see how easy it can be to get your business math back under control.

People Also Ask
FAQs (Frequently Asked Questions)
1. What is the Chart of Accounts in QuickBooks?
The Chart of Accounts in QuickBooks is a list of all the accounts used to categorize transactions and prepare financial statements. It includes assets, liabilities, equity, income, and expenses.
2. How can I customize the Chart of Accounts in QuickBooks?
You can customize the Chart of Accounts in QuickBooks by adding, editing, or deleting accounts to better reflect your business’s financial structure and reporting needs.
3. Why is it important to organize the Chart of Accounts effectively?
Organizing the Chart of Accounts effectively helps in accurate financial reporting, easier tracking of income and expenses by categories, and streamlined tax preparation.
4. What are some tips for improving QuickBooks reports using the Chart of Accounts?
Tips include using sub-accounts for better categorization, maintaining consistency in naming conventions, and regularly reviewing and updating accounts to match business needs.
5. How can I use classes and subclasses in QuickBooks alongside the Chart of Accounts?
Classes and subclasses in QuickBooks allow you to further categorize transactions by department, location, or project, providing deeper insights into profitability and expenses beyond the Chart of Accounts.
6. What role does account reconciliation play in maintaining accurate reports in QuickBooks?
Account reconciliation ensures that the balances in your QuickBooks accounts match the actual balances from bank statements or other financial records, thereby improving the accuracy of financial reports.
7. What are the benefits of creating custom reports in QuickBooks based on the Chart of Accounts?
Custom reports based on the Chart of Accounts allow you to analyze specific financial metrics, track key performance indicators, and gain insights tailored to your business’s unique needs.
8. How can I troubleshoot discrepancies in QuickBooks reports related to the Chart of Accounts?
Troubleshooting discrepancies involves verifying transaction details, reconciling accounts regularly, and ensuring proper categorization in the Chart of Accounts to maintain accurate financial reporting.
9. Are there industry-specific considerations when organizing the Chart of Accounts in QuickBooks?
Yes, industries may have specific reporting requirements. Customizing the Chart of Accounts to reflect industry standards ensures compliance and provides relevant financial insights.
10. Where can I find more resources and guides for optimizing QuickBooks reports through the Chart of Accounts?
Additional resources and guides are available on the Build Your Numbers website.
![]()
Customer Praise For Diane Gilson, Info Plus Accounting, and BuildYourNumbers.com
⭐⭐⭐⭐⭐ From the Intuit FindAProAdvisor website:
“We have a multi-state, multi-entity business that has grown to be 10x its original size in 5 years. Revenue is now in excess of $11m. When we migrated to QuickBooks, Diane guided us through the process and was instrumental in the successful implementation by our accounting staff. As we took on the advanced inventory functions, including 50 storehouses (trucks) and six bricks and mortar warehouses she help us configure things properly and that enabled us to get control of a fast-turning inventory. Diane has been a reliable expert resource for all things QuickBooks. Her answers and processes are accurate and we trust her implicitly.”
See More Customer and Client Comments