Can you really affect your gross profit by setting up a job costing system? Is it worth the time, energy, and effort involved to measure and track your numbers? Let’s visit with the owners of four (hypothetical) companies; then decide for yourself which owner’s shoes you’d prefer to step into…
As background to the story – we’ve learned the following about these companies and their owners: Each company is very similar in terms of:
 Gross revenue ($300,000 in the first quarter and anticipated $1.2M for the year),
- Quarter 1 Gross profit results,
- Number of jobs taken on each year (each company manages 4-5 major jobs at a time),
- Types of work performed,
- Number of employees,
- Years in business, and
- They each use one of the QuickBooks desktop versions as their accounting package.
BUT three of the four owners are NOT happy with the weak gross profit percentage they see for their first-quarter results.
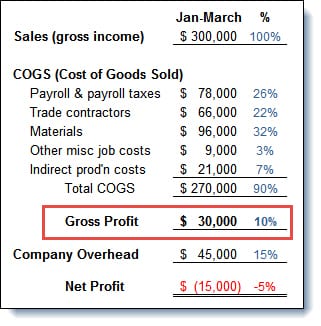
Sales are on target, but their gross profit percentage is only 10%!
This means after they subtract their standard 15% company overhead costs, they’re left with a Q1 bottom-line loss of $15,000.
Needless to say, each company wants to turn the current situation around as quickly as possible.
Not-So-Great Gross Profit Margins for the Company
Bob’s Get-It-Done-Right, LLC
($15,000 Loss)
Bob is primarily interested in the basics he needs for his tax accountant. He’s not very comfortable working with numbers, so he doesn’t want to invest valuable time in tracking job costs.
He’s identified his primary “costs of production” and created COGS (Cost of Goods Sold) accounts for tracking purposes. He believes this level of information should be sufficient.
As a result, Bob’s first-quarter Profit & Loss report shows his Gross Profit of $30,000 (10% of Sales), less $45,000 of Company Overhead, which leaves a $15,000 Loss.
He’s fairly sure that he’s making money on all of his jobs, but he’s not sure why the gross profit is so low. He’s reviewed his numbers but feels like he’s still pretty much in the dark.
Bob has two kids in college and knows that he can’t continue with these kinds of losses. So he’s left to worry and ask questions like, “What happened?” And, “What needs to happen next?”
“Simply Super” Gross Profit Margins – (For Each Job?)
Sue’s Simply-Super-Service, Inc.
($15,000 loss: Reports show outstanding job income but lots of “No job” costs)
Sue decided last year that she wants to know what she’s spending (and earning) on each job.
Although she requires her employees to track their time so she can use it for Invoicing, she’s not quite ready to use the payroll module in QuickBooks. So she’s continuing to outsource her payroll and enters the total payroll costs using summary journal entries.
If you add up the total Sales, COGS, and Company Overhead numbers, her first quarter Profit & Loss (P&L) TOTALS are the same as Bob’s (see above).
But she also receives a P&L (Profit & Loss) by Job report. She can definitely see MORE than Bob about what’s happening with job income and costs in her company…
Sue Reviews Her Report:
She reviews her results. Wow! Look at those gross profit margins: 57%, 39%, 53%, and 32%! Those jobs are looking “super good,” right?
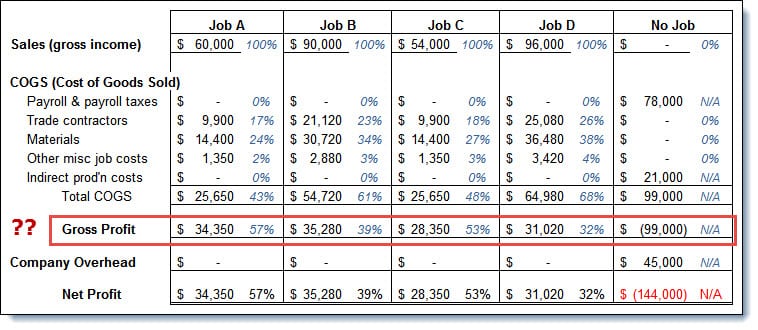
BUT WAIT – what about the $78,000 of payroll and payroll taxes sitting in the “No Job” column?
And how should we think about the $21,000 of indirect production costs that are not assigned to jobs? Those amounts cover employee benefits, vehicle costs, fuel, small tools, and miscellaneous job costs. They’re all part of getting the jobs done!
Sue’s now wondering “How am I REALLY doing on each job?” She sees that, by not assigning payroll costs and indirect production costs to jobs, those job cost reports are missing more than 1/3 of her total COGS costs ($99,000 of “no job” costs ÷ $270,000 of total COGS = 37%).
The first quarter’s loss worries her:
- Will she need to outsource more and lay off one or more of her loyal employees?
- Does she need to charge more for her work?
- Will she be able to turn things around?
She’s been working incredibly long hours to make things run smoothly, but this is a setback. The stress is beginning to keep her up at night…
Looking for a prebuilt Chart of Accounts, Cost Codes, and Job Cost Reports
for your QuickBooks desktop software?
Click here or on the image above to check out AccountingPRO™
Scoring the Winners and Losers in the Gross Profit Margin Game
Dave’s Dandy Results, LLC
($15,000 Loss BUT with ‘fully-loaded’ job cost information)
Dave had the same bottom-line loss of $15,000, but his reports look slightly different. He decided about a year ago to:
- Have employees track their time,
- Use the QuickBooks payroll module to post payroll and payroll taxes to jobs, and
- Assign indirect production costs to jobs using Info Plus Accounting’s eCPA (employee Cost & Pricing Analyzer™) tool.
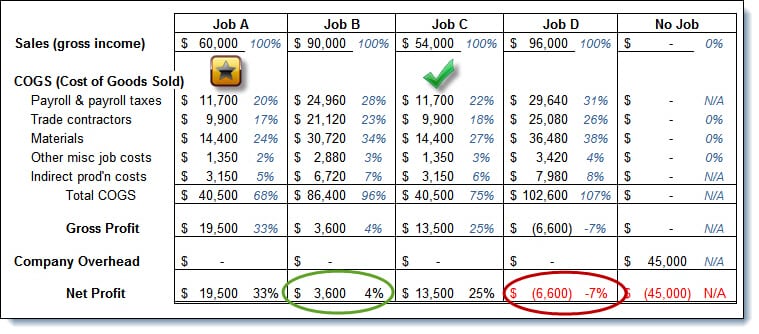
His Profit & Loss by Job report now shows ALL costs assigned to jobs.
Last year was a busy year, so he didn’t carve out time to review his results. But, beginning this quarter, he’s resolved to really dive into the new reports.
Dave “Grades” His Jobs…
He immediately sees that he has experienced a couple of “loser” jobs:
- Job B limped in at a miserable 4% gross profit (circled in green), and Job D actually lost $6,600, so he circled that one in red.
- On the other hand, Job C came in at 25% gross profit (right on the mark to contribute 10% to the bottom line after its share of the 15% company overhead)- so he gave it a green ‘approval’ checkmark).
- Job A was the real star – coming in with a 33% gross profit margin – so he awarded it a gold star.
Note: The margin percentages presented in this article are simply for purposes of illustration, comparison, and discussion. Gross Profit and Net Income targets and ‘acceptable’ margins can vary widely based on industry, company size, and shareholder decisions, so each company must set its own specific goals.
Job Cost Reports Raise New (and Important!) Questions…
Although he’s not happy about this quarter’s overall loss of $15,000, Dave’s still quite pleased with the information he has at hand because he can now use it to think about, compare, and investigate exactly how the losers differed from the winners. For example, he’s able to start asking questions like:
- Were these different KINDS of jobs? If so, should we make the move to turn down those ‘loser’ types of jobs in the future and concentrate on the more lucrative job types?
- Is there a ‘niche’ market here that we should explore?
- Were the jobs performed at different locations? Did the location impact profitability and how should that information affect future pricing?
- Were they ‘standard’ or ‘highly customized’ jobs? To what extent did the unique nature of the job impact the outcome?
- Could the original cost estimates or pricing be at fault? Did we learn everything we should have taken into account before the job started? If not, how can we improve the estimating and pricing process in the future?
- Who were the job supervisors? What’s each supervisor’s history for bringing jobs in on time and on budget? Should we consider additional training for certain people – or do we need to consider more drastic measures?
How to Build On What He’s Started…
Dave is impressed with the importance of what he’s looking at. He realizes that the information in these new reports will help him ask these kinds of key questions – and the resulting answers will be of incredible value in shaping the future direction and success of his company.
He knows that keeping his company alive and successful impacts many people: he has a wife, two grade-school children, loyal customers, and he cares a great deal about the livelihood and families of his long-term, experienced employees.
Dave’s certain that he’s been moving in the right direction. He’s glad he inspired his team to implement a system that provides him with this critical information. But he also wishes he could have (somehow) been able to minimize the problems on those two ‘loser’ jobs before they got so far out-of-hand.
It’s obviously too late to change the outcome for those particular jobs, but shouldn’t there be a way to access some “in-process” job reports in the future? A report he could use to stay on top of the information throughout the life of a job – so that he could help to keep it on track?
An Unexpected Windfall…
As a result, he started discussing what he was looking for with Paul, one of his mentors and fellow business owners, at a networking event.
Paul listened intently, shook his head, gave him one of his sympathetic, “I get it. I’ve been there too.” grins, and then invited Dave over to his office.
Paul said that he wanted to show him some samples of the detailed job-monitoring reports that they’d been using at his company for the last 18 months. “Those reports”, he says, “have made a big difference in how we approach each job, and how profitable they end up being. Our gross profit dollars and percentages are getting better by the day.”
Paul’s Approach to Taming the Gross Profit Problem

Paul shows Dave how to fill in a major piece of the puzzle.
He shares how he’s been using some specific QuickBooks techniques to create, and extract, the critical information he needs to monitor, and course-correct, each job’s progress in ‘real-time’ mode. Read Part II…
Learn more about our construction accounting and manufacturing program classes and discover our job cost support products!
Customer Praise For Diane Gilson, Info Plus Accounting, and BuildYourNumbers.com
⭐⭐⭐⭐⭐ From the Intuit FindAProAdvisor website:
“We were a small build-to-inventory manufacturing company struggling with an inappropriate bookkeeping software program when we decided to convert to Quickbooks. Diane Gilson did an excellent job during installation and in follow-up – at a reasonable cost. Diane’s input was timely, not overwhelming, and urged us forward when we needed a push. We continue to be very pleased with the results.”
See More Customer and Client Comments